
|
|
Do you have a weather station? Is it connected to Weather Underground on the Web? Did you ever want to view your Weather Data at home on your computer? Then this application called WUnderStatistics comes in handy. It was originally designed for the Lacrosse WS-2355 in particular, but the WUnderStatistics has been tested sucessfully with data from other weather stations as well as can be seen in the list further down on this page. The WUnderStatistics also supports the EasyWeather file format, csv files that can be downloaded from weather stations with the EasyWeather software.
|
|
What WUnderStatistics displays as plotted curves
Day files
|
- Temperature with labels for maximum and minimum temperature
- Average Temperature
- Total Rainfall or Total Rainfall calculated from Hourly Precipitation
- Dewpoint with labels for maximum and minimum temperature
- Air Pressure in hPa with labels for maximum and minimum pressure and Air Pressure trend
- Air Pressure trend (rising, falling) when selected in SetUp
- Wind Speed as staples or as a curve
- Wind Gusts
- Relative humidity with labels for maximum and minimum percentage
- Cloud Base in meters and feet above sea level (or above the WX station level)
- Wind Direction as a curve and in a Wind Rose
- Mean Wind Direction
- Percent calm
- Solar Power in W/square meter (if the weatherstation provides this option)
- UV Index (if the weatherstation provides this option)
|
|
Week and Month files |
|
Because of the many parameters saved to these files (High Temperature, Average Temperature, Low Temperature, High Dewpoint, Average Dewpoint, Low Dewpoint, High Humidity, Average Humidity, Low Humidity, Maximum Air Pressure, Minimum Air Pressure, Maximum Wind Speed, Average Wind Speed, Max Wind Gust Speed, Solar Power, Precipitation and UV Index), not all data are plotted.
The default curves shown when a Week or Month file is opened are:
- Maximum temperature with a label for maximum temperature
- Minimum temperature with a label for minimum temperature
- Maximum relative humidity without labels
- Minimum relative humidity without labels
- Maximum air pressure in hPa with a label for maximum pressure
- Minimum air pressure in hPa with a label for minimum pressure
- Wind Speed as staples or as a curve
- Wind Gusts
- Accumulated rainfall for the period
Use the check boxes and the radio buttons in the frame "Show" to the right of the plot field to select other data.
|
|
What WUnderStatistics displays as tables
|
- Dewpoint, max. and min in °C, value and at what time
- Air Pressure in hPa, max. and min, value and at what time
- Max. Wind Speed in km/h, value and at what time
- Max. Wind Gust in km/h, value and at what time
- Relative Humidity in percent, max. and min in °C, value and at what time
- Cloud base in meter and feet above sea level and at what time. If the altitude of the weather station is set to 0 in Set-Up, then the Cloud base is displayed as meter and feet above the location of the weather station
The time stamp shows time of the the max. cloud base height
|
|
The Wind Rose shows the Wind Direction Distribution. The Mean Wind Directed is shown as a value in degrees and as a red line in the Wind Rose
|
- Wind Direction Distribution in 16 directions (weather station dependent)
- Percent Calm during the period
- Graphic display of the Wind Direction Distribution, either as spokes or as area (as set in Set-Up)
- Percent Wind Direction Distribution by placing the mouse on the Wind Direction labels
|
|
An overview of Temperature and Precipitation
|
- Logged period from / to (date and time)
- Maximum Temperature in °C with time stamp
- Minimum Temperature in °C with time stamp
- Average temperature for the period
- Total rainfall for the period
and the method for the rain measurement
|
|
Notes and comments
|
- Weather notes for the file, max. 160 characters
- In case of snow, the snow depth can be saved to the file. (The Snow option can be hidden if there is no need for this option.)
- Special comments for the file, such as edited data because of corrupt or spurios data in WU or notes about hardware changes etc. will be marked with a flag to the right of the command button, if present.
|
|
What the WUnderStatistics does:
|
|
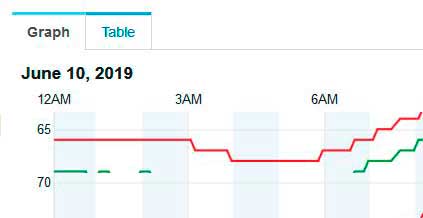
In a one day file the temperature, humidity, dew point and the barometric pressure are presented as curves. Rain will depend on the type of weather station you are using. Those weather stations that measure rain rate will present rain as blue vertical lines at the bottom of the chart. The wind is also presented as white vertical lines in the bottom of the chart, but in case there is wind more or less the whole day, you can choose to plot wind as a curve instead. The wind gusts are plotted as pink dots. The wind/rain scale is logarithmic to save vertical space. If the wind and rain is less thatn 10 mm or 10 km/h, the scale will end at 10. If one of the two exceeds 10 mm or 10 km/h , then the scale will add a decade to 100. Some weather stations that collect sunshine data. In this case there is an option to plot Watts per square meter. In this case there will be an additional scale on the left side with power readings up to 1000 W (1 kW) per square meter. Power less than 10 W per square meter are not plotted.
The UV Index uses the same scale as the rain (1 - 10.)
In week, month and year files the plot differs because the different data compiled in Weather Underground compared to the the day files.
|
|
How to install WUnderStatistics application on your computer
|
|
The WUnderStatistics has been tested on Windows XP and Windows 10. The WUnderStatistics size on the screen is 1251 x 701 pixels and should fit on most monitors and notebooks.
First download the WUnderStatistics zip package to your computer. The zip file contains the WUnderStatistics.exe and the comdlg32.ocx. Unzip the files to a folder named WUnderStatistics (or any name you would prefer).
You can now run the WUnderStatistics application. At the very first run some empty folders will be added to the folder which you created. Therefore press YES when the question pops up. The next step is to go to Weather Underground to get some of your weather data to plot.
If the installation was successful, then proceed to "How to save downloaded WUnderGround data to your computer" in the next paragraph.
In case you for some reason or another would like to register the file comdlg32.ocx manually, then follow the steps below.
As the comdlg32.ocx is not distributed with Windows 10 any more, the file needs to be registered. Follow the steps here below carefully and be extra careful that you spell exactly as described:
| 1. | Copy comdlg32.ocx to where you saved the WUnderStatistics.exe, best is to name the folder 'WUnderStatistics'. You must register this file before you can use it, otherwise you will get an error comdlg32.ocx is missing or invalid . |
| 1.1 | Right-click on START and click on Command Prompt (Admin). You must register the file comdlg32.ocx using Admin rights. |
| 1.2 | Click YES to go on after the pop-up message Do you want to allow... |
| 1.3 | Carefully type 'C:\windows\system32\regsvr32.exe C:\WUnderStatistics\comdlg32.ocx' (without the quotation marks), then press ENTER. DO NOT CLOSE the Command Prompt window.
|
| 1.4 | If everything went OK a message appears saying the registration was successful. If not, please check your spelling and try again. |
|
|
Grab Screen Data from Weather Underground for the WUnderStatistics App |
|
Since June 2016 it is no longer possible to download weather data if you were not signed in with the account associated with the station (as its owner).
Then from 2019 the download option in Weather Underground was removed. Therefore the WUnderStatistics had to be re-designed to use data grabbed directly from the PC screen instead.
|
|
How to grab and save WUnderGround data to your computer
|
|
The weather data files will be saved in the WUnderStatistics Directory under Daily Files, Weekly Files or Monthly Files. Those Directories were created the first time you started WUnderStatistics.
Next, go to Weather Underground and open your Weather Station (or any station of interest to you). The weather data for the present day will be plotted up until the last upload from the weather station.
| 1. | Prepare files to plot: Go to WeatherUnderground and select 24 hours of data. That is usually the data from the previous day. You can of course grab data for part of the day if you so desire. |
| 2. | Click on the 'TABLE' on the left hand side above 'Weather History Table' to switch the screen from Graph to Table mode.
|
| 3. | Left-Click and hold the mouse button on the 'Time' on the left hand side of the header and drag the mouse down a row or two and continue to drag the mouse towards the right until the mouse reaches the right border of the table. This method works with Firefox and Google Chrome. Microsoft's browsers have not been tested. |
| 3.1 | A second method in order to copy the date of an older Day File is to click and hold the mouse button at the first letter of the date, here in the 'J' of 'June 4'. Left-Click and hold the mouse button and drag the mouse down a row or two and continue to drag the mouse towards the right until the mouse reaches the right border of the table. |
| 4. | Continue to drag the mouse slightly across the right border. Note that all data will be highlighted. Release the mouse button and then press CTRL+C to copy the data to Clipboard, then start the WUnderStatistics.

A One Day screen. Start in 'Time' and continue out beyond the right side of the table.

A variation of a One Day screen including the date. Start in the 'J' in 'June 4' and continue out beyond the right side of the table.

A Week or Month screen. Start in 'Date' and continue out beyond the right side of the table.
|
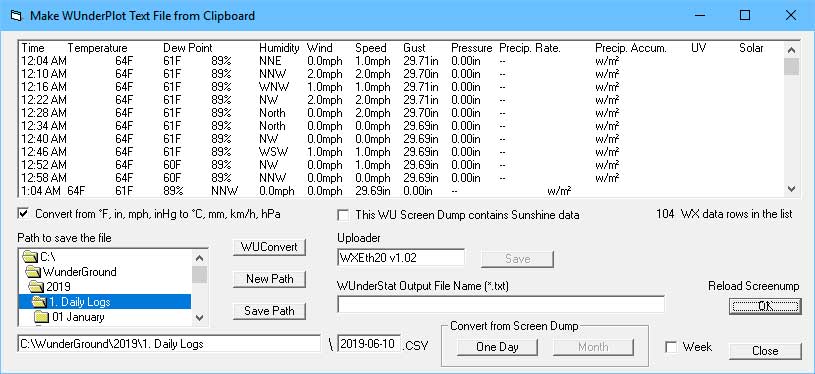
| | In WUnderStatistics, click the 'Convert File' button. The File Converter window opens and the selected data is automatically pasted to the list. Select the path to save your data file to and click Save. Today's date will be the default file name.
If the Day file was copied as described in 3.1 above, th date will automatically be added to the file name. Still, if you want, you can change the date manually if necessary.
Next, convert the file by clicking either 'One Day', 'One Week' or 'One Month'. The text file will be saved to the Directory selected in the text box at the bottom left, i.e. 'C:\WUnderStatistics\2019\Daily Logs\06 June\2019-06-10'.
The temporary CSV file is then automatically converted to a 'TXT' file and the CSV file is then deleted from the computer.
Close the File Converter and open the file by clicking 'Get File' in WUnderStatistics.
|
|
Saving The Files
|
|
5. | By default the File Converter saves your files in the following 'yyyy-mm-xx' format:
- One day Files: 2019-06-10,
- Week Files: 2019-06-w1 (w1 for the 1st week, manually change the text box to 'w2' for the next week etc.),
- Month Files: 2019-06-00 (the '00' is used by the WUnderStatistics to recognize a Month File.
Note: One year files are no longer supported in Weather Underground and have been removed from WUnderStatisics.
IMPORTANT: Never edit anything before '2019-'. You may write comments after the Date such as '2019-01-27MyTestFile.txt. Always use the file extension '.txt' when editing file names in an editor otherwise you not be able to open the files.
|
|
Plotting Weather Underground Data:
|
|
Start WUnderStatistics.exe and click on 'Get File'. Go to the Directory where you keep your Weather Data Files, open a file of your choice and he file will be processed and plotted."
|
The application uses the data that is displayed on Weather Underground. That means that this information is used by WUnderStatistics and will be presented as curves or data in a table. As the data in a file for one day file differs from the weekly and monthly files, the display differs between the two formats. Rain is measured differently by the Weather Stations. Some measure 'Rain Rate' and others adds up the rain during the period as 'Daily Rain'. The plotted rain will therefore differ for different Weather Stations. Some Weather Stations measure Sunshine in W / sq. m. If there is Sunshine data you can toggle between sunshine and rain. The UV index is present in the data grabbed from Weather Underground and is plotted regardless of rain.
|
|
Loading a File and Navigating Through the Files
|
To load the first file in a Folder, click on the "Get File" button. Navigate with the File Manager to the folder of your choice, click on a file name and open the file with "Open". It is possible to scroll back and forwards in the folder by pressing the left and right arrows beside the
"Get File" button.
|
|
Additional ways of navigating through the folder by using the numerical keyboard
|
|
|
|
- "PgUp" displays the next file in the folder
- "PgDn" displays the previous file in the folder
- "Home" diplays the first file in the folder
- "End" diplays the last file in the folder
- "+" jumps 10 files up in the folder
- "-" jumps 10 files down in the folder
|
|
|
|
Requirements and download the WU-Plotter:
|
|
WUnderStatistics is 1251 pixels wide and 701 pixels high. Therefore the recommended screen size should be at least 1366 x 768 pixels to fit the application on the screen of the computer or notebook. It has been tested on Windows XP and Windows 10.
|
|
Download the V3.4 version of the WUnderStatistics file and install the application as described.
|

